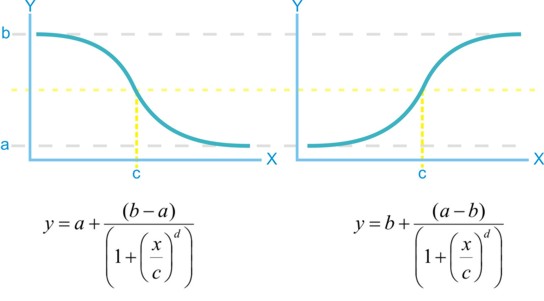

The IC50 value will be most accurate if the measurements follow a proper sigmoid curve i.e. there is a flat part, then a sloping part and finally another flat part. In cases where the Y-values just decrease or increase, the curve may appear to fit well but the resulting IC50 and other values can be wildly wrong, so caution is needed. In these cases it may be better to use the Exponential Tool Kit. When the fitting does not work, more measurements at higher and lower concentrations may be needed, although sometimes rescaling the values on an axis by a constant factor (e.g. 103 or 106) can help. For more help on obtaining a plot, see the detailed notes provided in the data input box.
The aim is to display measurements obtained by the user as a function of ligand concentration using the Matplotlib package and to display a best-fit curve obtained using the SciPy non-linear least-squares fitting routine. If the x-values are spread over a wide range (i.e. several orders of magnitude), a logarithmic scale on the X-axis is drawn.
The website is run by a Python program which can be obtained here. Where possible, standard deviations of the kinetic parameters are displayed. The final quality of the curve-fit and the resulting parameters must, at least, be checked carefully and, ideally, verified using an alternative means.
Please send any comments or suggestions for improvements to jbcooper@fastmail.net and feel free to acknowledge the IC50 toolkit (ic50.org) if it is useful.